Understanding the Percent Error Formula
The percent error formula is a critical concept in fields like chemistry, physics, engineering, and mathematics. It is used to express the difference between an experimental value and a true or accepted value in percentage terms. This formula helps quantify the accuracy of experimental results and assess the reliability of measurements.
What is Percent Error?
Percent error is a measure of how inaccurate a measurement is, compared to the true value or accepted standard. It is commonly used to assess the precision of an experiment or to determine how close a measured value is to the actual value.
The Percent Error Formula
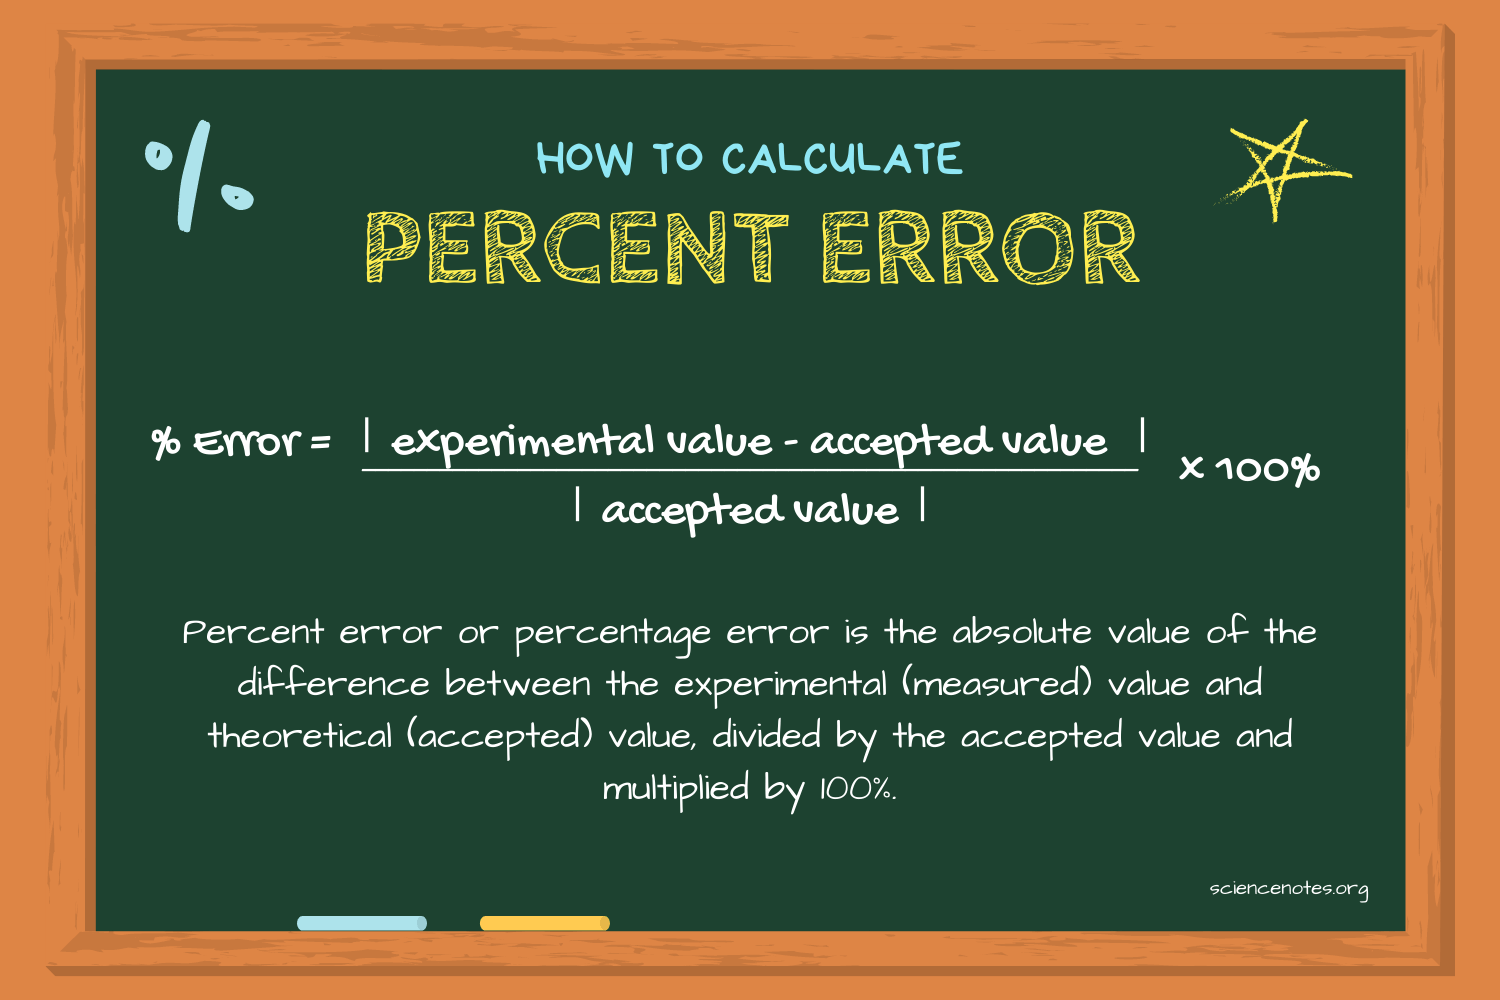
The percent error formula is given by:
Percent Error=(∣Experimental Value−True Value∣True Value)×100%\text{Percent Error} = \left( \frac{|\text{Experimental Value} – \text{True Value}|}{\text{True Value}} \right) \times 100\%Percent Error=(True Value∣Experimental Value−True Value∣)×100%
Here’s a breakdown of the formula:
- Experimental Value: This is the value that you obtain from your experiment or measurement.
- True Value: This is the actual or accepted value, which is considered to be accurate.
- Absolute Value: The absolute value (denoted by the vertical bars) ensures that the result is always positive, reflecting the magnitude of the error regardless of its direction.
Importance of Percent Error
Percent error is essential because it provides a standardized way to compare the accuracy of different measurements. It allows scientists and researchers to determine how close their experimental values are to the true values and to identify potential sources of error in their experiments.
How to Calculate Percent Error
- Determine the Experimental and True Values: Identify the values you obtained from your experiment and the accepted or true value.
- Calculate the Difference: Subtract the true value from the experimental value.
- Take the Absolute Value: Ensure the difference is positive by taking the absolute value.
- Divide by the True Value: Divide the absolute difference by the true value.
- Multiply by 100: Convert the result into a percentage by multiplying by 100.
Example Calculation
Let’s consider an example where you are measuring the density of a substance. Suppose the true density of the substance is 8.96 g/cm³, and your experimental measurement is 9.15 g/cm³.
- Experimental Value: 9.15 g/cm³
- True Value: 8.96 g/cm³
- Difference: 9.15−8.96=0.199.15 – 8.96 = 0.199.15−8.96=0.19
- Absolute Value: ∣0.19∣=0.19|0.19| = 0.19∣0.19∣=0.19
- Divide by True Value: 0.198.96=0.0212\frac{0.19}{8.96} = 0.02128.960.19=0.0212
- Multiply by 100: 0.0212×100=2.12%0.0212 \times 100 = 2.12\%0.0212×100=2.12%
So, the percent error in this measurement is 2.12%.
Sources of Error
Several factors can contribute to the error in measurements:
- Instrumental Errors: These are errors caused by imperfections in measuring instruments. For example, a scale that is not properly calibrated can give inaccurate readings.
- Human Errors: These are errors caused by human mistakes, such as misreading a measurement or recording incorrect values.
- Environmental Errors: These are errors caused by environmental factors such as temperature, humidity, and pressure that can affect the measurement.
- Methodological Errors: These are errors caused by using incorrect methods or procedures during the experiment.
Reducing Percent Error
To minimize percent error and improve the accuracy of measurements, consider the following tips:
- Calibrate Instruments: Regularly calibrate measuring instruments to ensure they provide accurate readings.
- Repeat Measurements: Perform multiple measurements and take the average to reduce random errors.
- Improve Techniques: Use precise and accurate techniques for measurements to minimize human errors.
- Control Environment: Maintain a controlled environment to minimize the impact of external factors on the measurements.
- Use Proper Methods: Follow standardized methods and procedures to ensure consistency and accuracy.
Conclusion
The percent error formula is a fundamental tool in scientific research and measurement. It helps quantify the accuracy of experimental results and identify potential sources of error. By understanding and applying the percent error formula, scientists and researchers can improve the reliability of their measurements and enhance the overall quality of their experiments. Whether you are conducting a simple classroom experiment or a complex research study, the percent error formula is an invaluable resource for assessing and improving measurement accuracy.
4o
Understanding the Margin of Error Formula
The margin of error is a crucial concept in statistics, especially when dealing with survey data and other forms of sampling. It provides a measure of how much the results obtained from a sample are expected to deviate from the true population value. Understanding and correctly calculating the margin of error is essential for interpreting survey results and making reliable predictions.
What is Margin of Error?
The margin of error (MoE) quantifies the uncertainty or potential error involved when using a sample to estimate a population parameter. It is typically expressed as a percentage and reflects the range within which the true population parameter is expected to fall. For example, if a survey reports a margin of error of ±3%, it means that the true value is expected to be within 3 percentage points above or below the reported value.
The Margin of Error Formula
The formula for calculating the margin of error depends on whether the population standard deviation (σ) is known or not. Here, we’ll focus on the formula used when the population standard deviation is unknown, which is more common in real-world scenarios.
Margin of Error=z×sn\text{Margin of Error} = z \times \frac{s}{\sqrt{n}}Margin of Error=z×ns
Where:
- z: The z-score corresponding to the desired confidence level.
- s: The sample standard deviation.
- n: The sample size.
Confidence Level and Z-Score
The confidence level indicates the degree of certainty that the true population parameter lies within the margin of error. Common confidence levels include 90%, 95%, and 99%. Each confidence level corresponds to a specific z-score, which is a critical value from the standard normal distribution.
- For a 90% confidence level, the z-score is approximately 1.645.
- For a 95% confidence level, the z-score is approximately 1.96.
- For a 99% confidence level, the z-score is approximately 2.576.
Calculating the Margin of Error
- Determine the Confidence Level: Decide on the confidence level (e.g., 95%).
- Find the Z-Score: Use a z-score table or calculator to find the z-score corresponding to the chosen confidence level.
- Calculate the Sample Standard Deviation (s): Compute the standard deviation of the sample data.
- Determine the Sample Size (n): Identify the number of observations in the sample.
- Apply the Formula: Plug the values into the margin of error formula to obtain the result.
Example Calculation
Suppose you conducted a survey with a sample size of 100 people to estimate the average number of hours people watch TV per week. The sample standard deviation is 2 hours, and you want a 95% confidence level.
- Confidence Level: 95%
- Z-Score: 1.96 (for 95% confidence level)
- Sample Standard Deviation (s): 2 hours
- Sample Size (n): 100
Using the formula:
Margin of Error=1.96×2100\text{Margin of Error} = 1.96 \times \frac{2}{\sqrt{100}}Margin of Error=1.96×1002
Margin of Error=1.96×210\text{Margin of Error} = 1.96 \times \frac{2}{10}Margin of Error=1.96×10²
Margin of Error=1.96×0.2=0.392\text{Margin of Error} = 1.96 \times 0.2 = 0.392Margin of Error=1.96×0.2=0.392
So, the margin of error is ±0.392 hours.
Importance of Margin of Error
The margin of error is vital for several reasons:
- Assessing Reliability: It provides a quantitative measure of the reliability of the survey results.
- Making Informed Decisions: Knowing the margin of error helps in making informed decisions based on survey data.
- Comparing Surveys: It allows for the comparison of results from different surveys or studies by considering their respective margins of error.
- Communicating Uncertainty: It helps communicate the uncertainty inherent in any survey or sampling process to stakeholders.
Reducing the Margin of Error
To reduce the margin of error and increase the precision of estimates:
- Increase Sample Size: Larger samples provide more information and reduce the margin of error.
- Reduce Variability: Use more precise measurement tools or more homogenous groups to reduce variability in the data.
- Adjust Confidence Level: Lowering the confidence level will reduce the margin of error, though it also decreases the certainty of the estimate.
Conclusion
The margin of error is a fundamental concept in statistics that helps quantify the uncertainty in survey results and other sample-based estimates. By understanding and correctly applying the margin of error formula, researchers and analysts can provide more accurate and reliable insights. Whether conducting market research, political polling, or scientific studies, the margin of error is a critical tool for assessing and improving the validity of conclusions drawn from sample data.